
Economic, social, community profiles and trends
This dashboard presents selected data that are relevant for monitoring economic activity in Canada.
- One report for Canada or the US. This report is issued monthly.
- Includes data on a range of monthly indicators – real GDP, consumer prices, the unemployment rate, merchandise exports and imports, retail sales, hours worked and manufacturing sales — as well as monthly data on aircraft movements, railway carloadings, and travel.
- Estimates are presented to the current reference month for each data series. The information will be updated continuously as new data becomes available, and additional series may be added to the dashboard as circumstances warrant.
- To support the analysis of time series movements in the data, the dashboard reports changes in each series on both a month-over-month and year-over-year basis. For most of the variables reported, information on cumulative changes in the data both prior and subsequent to the end of 2019 is also presented by indexing the level estimates to December 2019, as depicted in the accompanying charts.
- Sourced from over 8,000 data repositories including Statistics Canada, OECD, U.S. Bureau of Labor Statistics, Industry Canada, Canadian Institute for Health Information, US Census Bureau.
Report format
A link to a monthly micro website will be emailed to the subscriber. The website will contain the following tabs:
- Executive summary
- Key insights
- Data charts
Back to Dashboard Overview
FEATURES
- Flexible queries – Broad national/regional or deep dive into a specific query
- Qualitative and quantitative insights with exhaustive in-depth analysis
- Longitudinal or cross-sectional data depending on query
- Over 8,000 secondary data sources
SUBSCRIPTIONS
- Monthly subscription with automatic billing.
- No contracts. Cancel at anytime.
- Payment by credit card.
Macro Dashboard – Scope
State of the economy
What’s the state of the economy? We have identified a few key economic and market indicators to help assess the current economic health and trend.
Canada Macro Report synopsis. Read executive briefing sample.
SAMPLE CHART
As of: 09/29/2023
Updated monthly/quarterly to capture previous quarter-end values
Macro Economic Indicators
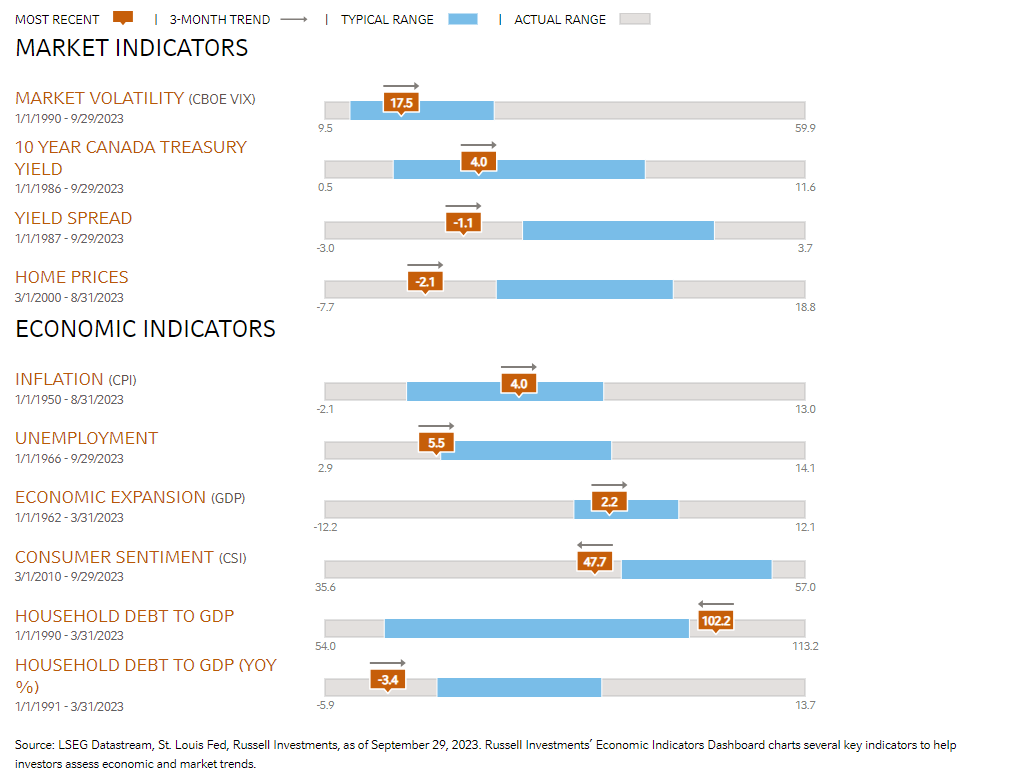
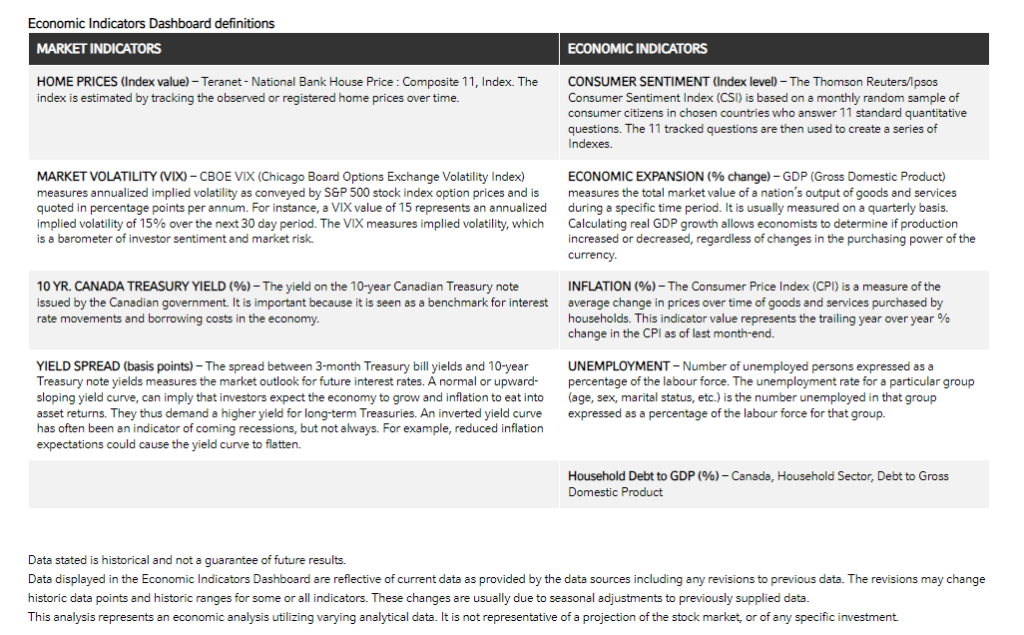
Economic indicators
Sample charts. See data points included in the economic indicators dashboard below sample charts.
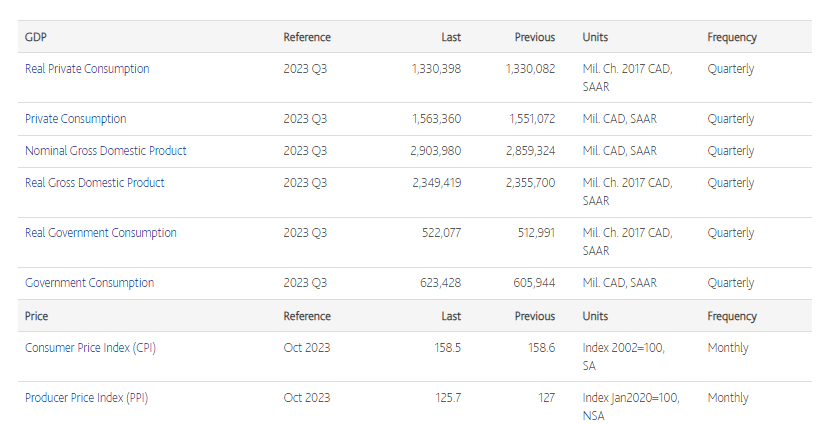
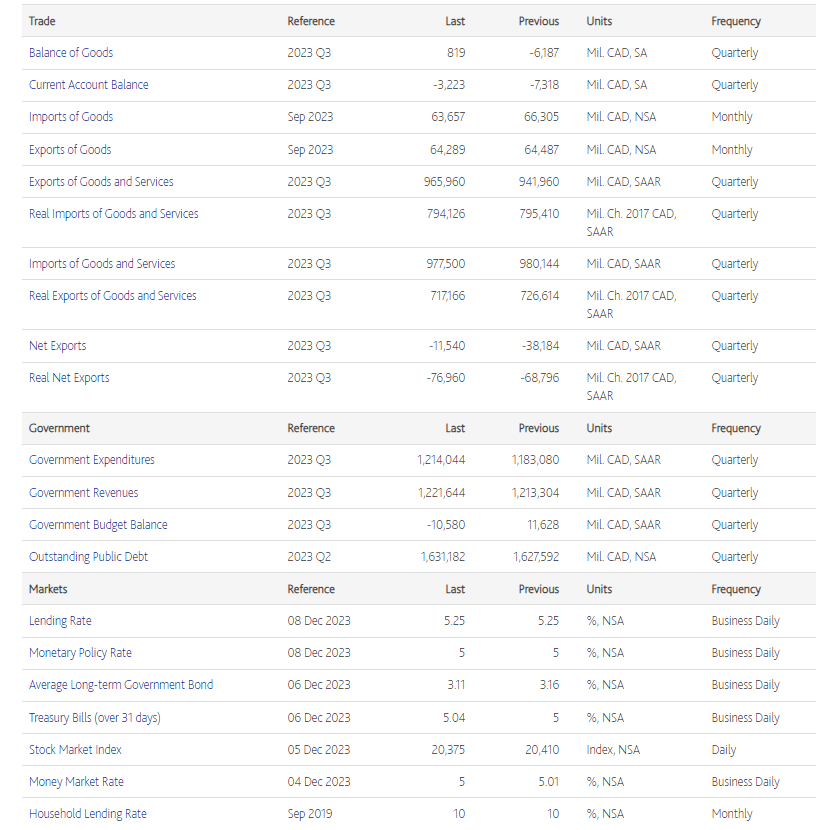
Economic indicators – Data points
| GDP |
| Real Private Consumption |
| Private Consumption |
| Nominal Gross Domestic Product |
| Real Gross Domestic Product |
| Real Government Consumption |
| Government Consumption |
| Price |
| Consumer Price Index (CPI) |
| Producer Price Index (PPI) |
| Labour |
| Labour Force |
| Total Employment |
| Unemployment |
| Labour Force Employment |
| Agriculture Employment |
| Unemployment Rate |
| Wage & Salaries |
| Trade |
| Balance of Goods |
| Current Account Balance |
| Imports of Goods |
| Exports of Goods |
| Exports of Goods and Services |
| Real Imports of Goods and Services |
| Imports of Goods and Services |
| Real Exports of Goods and Services |
| Net Exports |
| Real Net Exports |
| Government |
| Government Expenditures |
| Government Revenues |
| Government Budget Balance |
| Outstanding Public Debt |
| Markets |
| Lending Rate |
| Monetary Policy Rate |
| Average Long-term Government Bond |
| Treasury Bills (over 31 days) |
| Stock Market Index |
| Money Market Rate |
| Household Lending Rate |
| Real Estate |
| House Price Value for Existing Homes |
| Building Permits |
| Residential Building Permits |
| House Price Index for New Homes |
| House Price Index |
| Housing Starts |
| Building Completions |
| Consumer |
| Personal Income |
| Real Retail Sales |
| Retail Sales |
| Consumer Confidence |
| Business |
| Purchasing Managers index |
| Industrial Production |
| Demographics |
| Population |
| Births |
| Deaths |
Sample section on an indicator
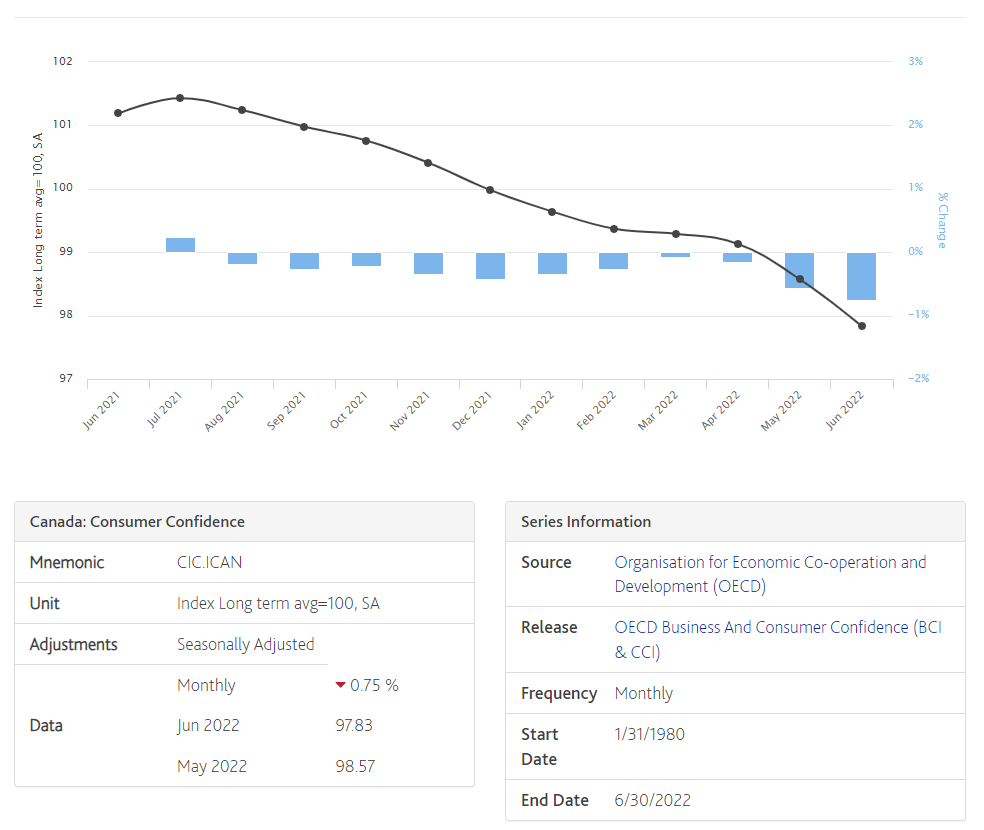
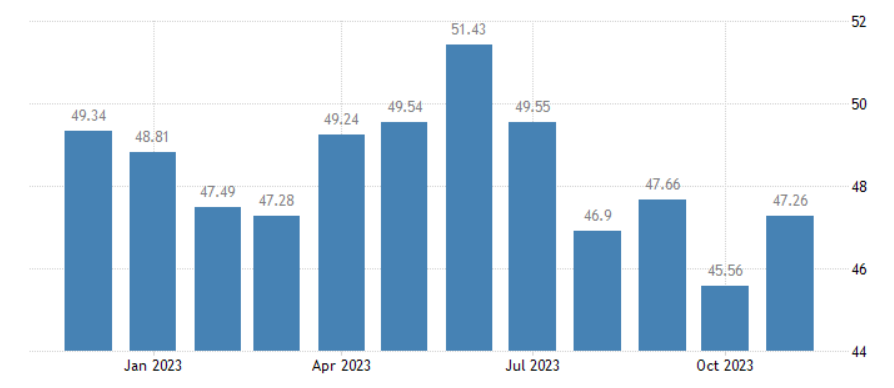
Consumer Confidence – Canada
Consumer Confidence in Canada increased to 47.26 points in November from 45.56 points in October of 2023. Consumer Confidence in Canada averaged 52.14 points from 2010 until 2023, reaching an all time high of 57.05 points in November of 2018 and a record low of 35.60 points in April of 2020.
Historical perspective
Latest reading of consumer confidence
In Canada, the Index of Consumer Confidence is calculated from the combination of responses to 11 survey questions. Those questions, current state of the economy in the local area and in the country and its expected state 6 mths ahead; current personal financial situation and the expected situation 6 mths ahead; making a major purchase like a home or car now compared to 6 mths ago; making other household purchases now compared to 6 mths ago; confidence about own and relatives’ job security and own ability to invest in the future and save money for retirement now compared to 6 mths ago and losing job as a result of economic conditions in the last 6 months and in the coming 6 mths. Consumer confidence is measured on a scale of 0 to 100, where 0 indicates an extreme lack of confidence, 50 neutrality and 100 extreme confidence. .The standardized Business Confidence Indicators (BCI) are confidence indicators comparable across countries. The standardized Consumer Confidence Indicators (CCI) are measures comparable across countries.
• The Business Confidence Indicators (BCIs) augment the information set of cyclical indicators by providing indicators that can reinforce signals of the Composite Leading Indicators (CLIs), since these indicators tend to have shorter but more stable lead times then the CLIs, and they are subject to little or almost no revision at all.
• The Consumer Confidence Indicators (CCIs) focus on a different aspect of the economic cycle. They are not particularly successful in signaling turning points in production; however they capture cyclical patterns in household consumption behaviour fairly well.