
Hint: It’s not R.
Multiple studies have suggested that just 10 to 20 percent of infected people are responsible for 80 to 90 percent of transmissions, and many people barely transmit it. So why are entire economies being shut down?
In Hong Kong, which has extensive testing and contact tracing, a recent paper found that 19 percent of cases were responsible for 80 percent of transmission, while 69 percent of cases did not infect another person.
Exposure to the Virus
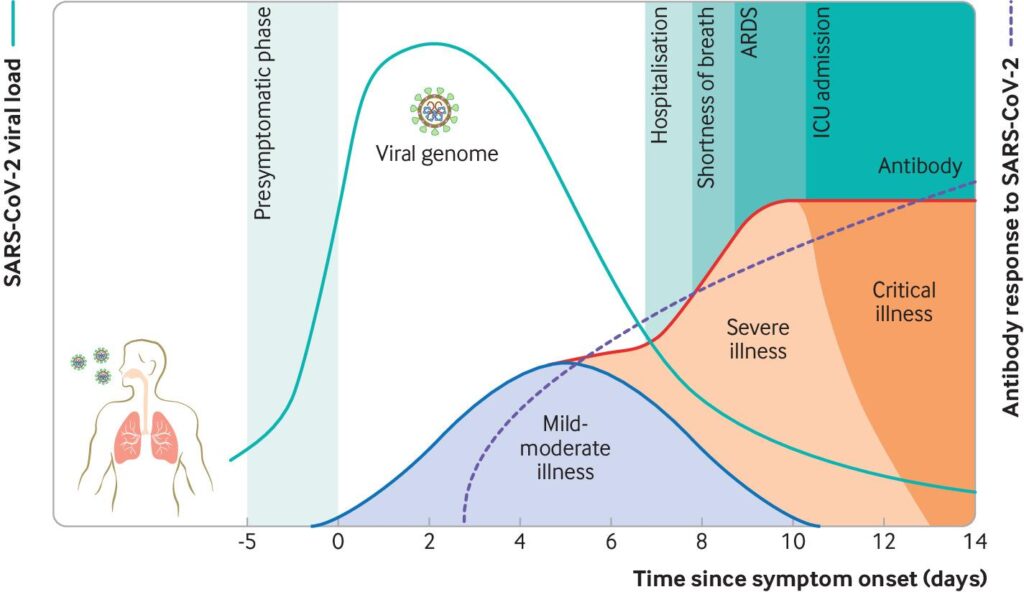
After the initial exposure, patients typically develop symptoms within 5-6 days (incubation period). SARS-CoV-2 generates a diverse range of clinical manifestations, ranging from mild infection to severe disease accompanied by high mortality. In patients with mild infection, initial host immune response is capable of controlling the infection. In severe disease, excessive immune response leads to organ damage, intensive care admission, or death. The viral load peaks in the first week of infection, declines thereafter gradually, while the antibody response gradually increases and is often detectable by day 14 (source: https://www.sciencedirect.com/science/article/pii/S009286742030475X; https://www.thelancet.com/journals/lanres/article/PIIS2213-2600(20)30230-7/fulltext)
What we know about the virus
SARS-CoV-2 is an enveloped β-coronavirus, with a genetic sequence very similar to SARS-CoV-1 (80%) and bat coronavirus RaTG13 (96.2%).2 The viral envelope is coated by spike (S) glycoprotein, envelope (E), and membrane (M) proteins (fig 1). Host cell binding and entry are mediated by the S protein. The first step in infection is virus binding to a host cell through its target receptor. The S1 sub-unit of the S protein contains the receptor binding domain that binds to the peptidase domain of angiotensin-converting enzyme 2 (ACE 2). In SARS-CoV-2 the S2 sub-unit is highly preserved and is considered a potential antiviral target. The virus structure and replication cycle are described in figure 1.

Fig 1
(1) The virus binds to ACE 2 as the host target cell receptor in synergy with the host’s transmembrane serine protease 2 (cell surface protein), which is principally expressed in the airway epithelial cells and vascular endothelial cells. This leads to membrane fusion and releases the viral genome into the host cytoplasm (2). Stages (3-7) show the remaining steps of viral replication, leading to viral assembly, maturation, and virus release
The super spreaders
In New Zealand, using genomic analysis, researchers found a staggering 277 separate introduction to more than one additional case in the early months when they looked at half the confirmed cases in the country. Moreover, only 19 percent of introductions led to more than one additional case.
In Northern Italy, just three contiguous regions have 25,000 of the country’s nearly 36,000 total deaths; just one region, Lombardy, has about 17,000 deaths. Almost all of these were concentrated in the first few months of the outbreak. Why was the death toll so high in northern Italy, but not the rest of the country?
Averages are irrelevant
Unfortunately, averages aren’t useful to understand distribution of a phenomenon with widely varying behavior. If Amazon’s CEO, Jeff Bezos, walks into a bar with 100 regular people in it, the average wealth in that bar suddenly exceeds $1 billion. If we walk into that bar, not much will change.
Things would change dramatically if the bar had a person infected with COVID-19, and the place was poorly ventilated and loud, causing people to speak loudly at close range, almost everyone in the room could potentially be infected— that’s why bars are a problem- a pattern that’s not captured by R. And hence, dispersion is critical.
R0 (pronounced as “r-naught”) is an average measure of a pathogen’s contagiousness. It is the mean number of susceptible people expected to become infected after being exposed to a person with the disease. If one ill person infects three others on average, the R0 is three. R0 is widely touted as a key factor in understanding pandemics. News media talk a lot about it. Pandemic movies have characters explain the “all-important” R0.
Dashboards track its real-time evolution as R or Rt, in response to interventions. (With rising masking, isolating or immunity, a disease can’t spread the same way, hence the difference between R0 and R.)
Finding the Super Spreaders
In Daegu, South Korea, just one woman, dubbed Patient 31, generated more than 5,000 known cases in a megachurch cluster.
So the question again is when the government of Ontario states the province has had over 1000 new cases each day, we must take a hard look at the numbers behind the numbers because it’s likely that a shockingly small number of people are causing the rise.
If we know where these super spreaders are, this Pandemic will be dead in its tracks. That’s where the government needs to focus its efforts. On finding the Super Spreaders.