Custom qualitative and quantitative check-in.
- Data for answers to specific and unique questions
- Qualitative or quantitative check-in with yes/no, numerical, or rating scale questions
- Trended data with 1-60 month frequency
- Secondary data only. Contact Arcus for primary research queries.
- Highly targeted and specific information requests
- longitudinal or cross-sectional insights
- Custom research subscription fee is based on up to 12 hours of research. Additional time will be prorated and will require pre-approval.
After you subscribe
Please fill in this form to schedule a call.
Back to Dashboard Overview
Centralized trends dashboard
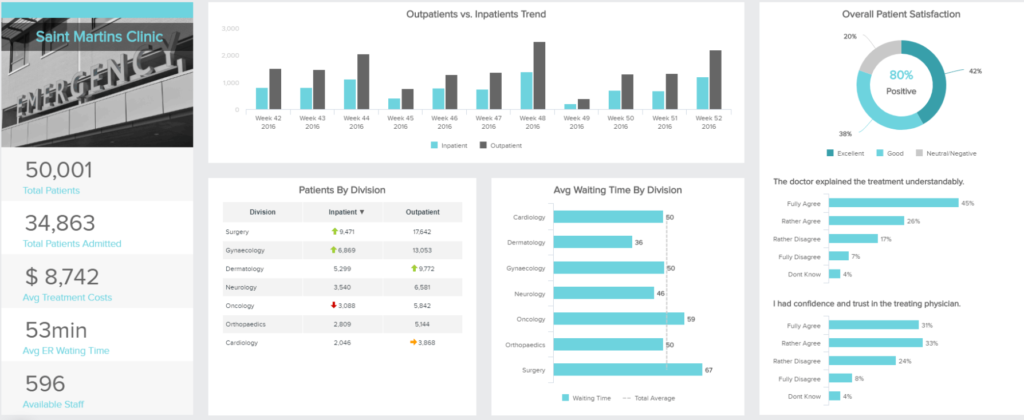
A centralized trends dashboard offers an efficient way to management to help you identify trends that may impact deliverables in your strategic plan or could help you fill in gaps in your data dashboard. You can determine over time, adapting that way the assignment of your resources, and generating sustainable development.
This dashboard will give you the big picture you need when running such a complex operation across multiple geographies. Giving you the principal metrics on the major category you need, you can track metrics over a certain period of time. This insights can also be broken down with qualitative or quantitative data points. The options are endless and will depend on the depth and width of your data requirements.
The trends dashboard example provided above aims at giving top management a holistic view of analytics data with global insights on how your strategy is working, so as to enhance your decision-making process.
SAMPLE QUERY
- Patient Satisfaction at a specific hospital site
Sample data Extract